Asset Allocation: The Key to Wealth Preservation
- Shantanu R Nakhate

- Mar 6, 2025
- 9 min read
The past few weeks have been a stark wake-up call for many investors who had heavily allocated their funds to the markets. Most, might have allocated to markets on narrative of inflation is eroding their net worth slowly and surely, and then they saw a rapid erosion of their wealth beyond decades of inflation put together in few months by allocating to markets. Meanwhile, news stories highlighted individuals liquidating their fixed deposits and eagerly diving into the markets inherently with hopes of making a quick profit and investing in disguise of wealth creation. It was during this time that I realized how history has a tendency to repeat itself.
In this article, I will delve into the concept of asset allocation and how to approach it quantitatively. This is not about guesswork; it's about adopting a realistic, data-driven strategy for wealth preservation.
A Brief History of Money
To understand the importance of asset allocation, let's take a quick journey through the history of money. In the early days, humans, much like animals, hunted for their food. They worked in teams to bring down large animal, and the food was shared among the hunters' families and sometimes with other teams who had not made a kill that day. This was a survival-of-the-fittest scenario with no concept of storage or long-term planning.
As humans evolved, they learned to store food, improve hunting techniques, and develop agriculture. They also developed language and mathematics, which led to the creation of various products and services. This progress eventually gave rise to the question of how to measure the value of goods and services and how to exchange them fairly. The barter system eventually gave way to the invention of money.
Early forms of money included cowrie shells. However, their widespread availability soon led to a search for more scarce and valuable materials. This transitioned to large rocks and eventually to gold and coins. After World War II, the United States made a significant change in 1971 by abandoning the gold standard and adopting the US dollar as a free-floating fiat currency. This meant that the dollar, backed by no tangible asset, became the global standard.
The shift to fiat currency allowed the US to print money at will, leading to an abundant supply and, consequently, depreciation in value. As the US's debt surpasses its net worth, the value of the dollar becomes increasingly precarious.
The Three Essential Qualities of Money
For something to be considered real money, it must possess three key qualities:
Store of Value
It should maintain its purchasing power over time, allowing it to be saved and used to purchase goods and services in the future.
Medium of Exchange
It must be easily transactable, facilitating the buying and selling of goods and services.
Unit of Account
It acts as a unit of account, providing a common measure for the value of goods and services. This means that prices are expressed in terms of money, making it easier to compare the value of different items. For example, a car might cost $20,000, a house $300,000, and a loaf of bread $2. This standardization allows for easy comparison and valuation, facilitating economic transactions and decision-making.
The Problem with Fiat Currencies
Fiat currencies, due to their ever-depreciating nature caused by government-controlled printing, lack the crucial quality of being a store of value. This means that the money we earn and save today is not truly preserving its value for the future. To counteract this, we need to find assets that can provide the "Store of Value" property of money.
Asset Allocation: Preserving Your Wealth
Given the depreciating purchasing power of fiat currencies, it's essential to allocate your assets wisely to preserve your wealth. Many of us work hard to earn these currencies, which are, in essence, no different from toilet paper. It makes sense to invest some effort into converting these hard-earned funds into assets that can truly store value.
Historically, assets like gold, silver, real estate, equities, and fixed income (bonds) have been accepted as stores of value. Among these, equities and fixed income are the most easily transactable without the hassle of dealing with physical assets. However, it's always wise to keep some physical gold and cash on hand in case of a potential crisis, such as a cybersecurity breach that could erase all digital assets.
What might an Asset Allocation Strategy Look Like?
When considering asset allocation, it's crucial to first identify what is an asset and whether it truly has the first property of Storage of Value of money.
Next you need to Identify which assets are currently undervalued in the current market cycle. A quantitative approach, such as using Camarilla Pivots, can be very useful here. Studying these pivots on higher time frames, like monthly charts, can provide insights into current market conditions and help in better decision making.
Now given that we accept the known risks of cyber security and broker going bankrupt (In India CDSL or NSDL holds the securities so that way this risk is a bit low) we can think of doing Asset Allocation in listed space in following areas.
Gold – Some ETF which tracks gold value with low tracking error and low expense ratio.
Silver – Some ETF which tracks silver value with low tracking error and low expense ratio.
The main Index of the country you are living in or the main index of the country you think would do well eventually.
Fixed Income from bonds which don’t depreciate the principal but can change the yield decided by some metric followed by government. It is critical not to be in possession of bonds with low yields as it may happen that the yields go up and bond value collapses.
REITs can be another asset class offering exposure to real estate spaces without buying a big physical space but, having some exposure in form of REITs and getting the yield from them.
Now as asset allocator you need to find out which one is the cheapest available in terms of market cycle. The work needs to be done around this using a quantitative method. Camarilla Pivots can be very useful here. One needs to study them using higher time frames like 1M. i.e. 1M is one candle in the chart. This shall give you the idea of how things are currently and take a quantitative guess of what might happen in future.
Here are few ETFs popular in India. Do note that there are many similar peers available. You may compare them based on expense ratio and tracking error and see which suits you.
ETF | Tracks | ETF | Tracks |
NIFTYBEES | Nifty 50 index | SENSEXBEES | Sensex index |
JUNIORBEES | Nifty Next 50 index | BANKBEES | Bank Nifty Index |
GOLDBEES | Tracks Gold price | SILVERBEES | Tracks silver price |
PHARMABEES | Has key stocks in pharma sector. | ITBEES | Has key Information Technology Sector stocks. |
CONSUMBEES | Has key stocks in consumer sector. | AUTOBEES | Has key stocks in Auto sector |
HNGSNGBEES | Tracks Hang Seng Index. (However, there is catch that it cannot create new units due to RBI restriction. So, in reality the current traded price times the units is not always equal to mark to market assets held by the ETF. So, it is very speculative.) |
Now that we have some example assets like above, let us now dive into asset allocation.
Since we have found that Cash (the fiat currency) is depreciating in nature we still cannot ignore it as an asset class, as it has the last two important characteristics of money.
So, we will keep it in here as fixed income asset class which cannot be stolen or vanished and still give inflation adjusted yield for you.
So let us start with an example scenario taking the advantage of hindsight to understand what we mean by doing asset allocation.
Here we will take Nifty 50 tracking fund NIFTYBEES and Gold Tracking fund GOLDBEES. (Do note that gold prices in India suffered 9% fall overnight on 23rd of July due to reduction of import duties by government. This was a classic case of how your holdings can get slaughtered by the decision of people in power. So, in general nothing is safe.)
Now let us see if we can get some idea of asset allocation.
Say we started our asset allocation journey on 1st of March 2017. If we allocate 50% to Niftybees we got around 34% pre tax returns on our holding. And say, we allocate 50% to Goldbees we got 7.93% gains. So, in total our net worth would go up by around 20.96% in two years. This is pretax.
If we had put this in a fixed gain asset like a Fixed Deposit or Government Bond then we might have got around 17.72% (assuming 8.5% returns every year) absolute pre tax returns.

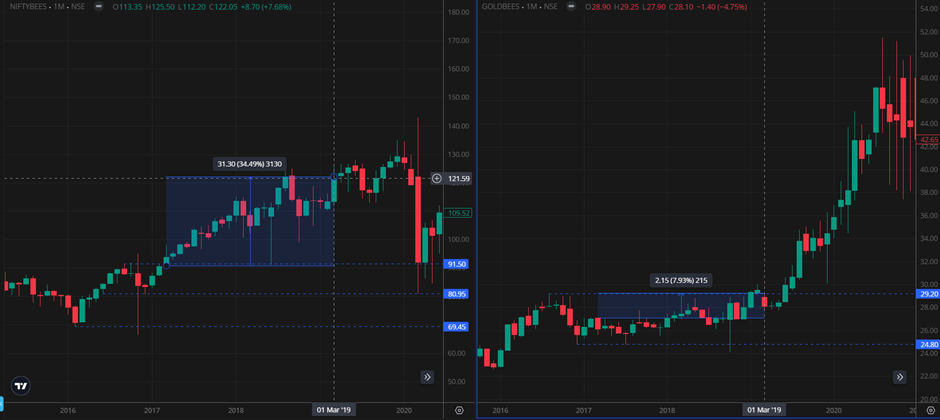
So, if you had some quantitative strategy to decide the percentage mix of Niftybees and Goldbees you would have ended up with better returns. Such percentage mixing of Niftybees, Goldbees, Cash, etc. would be called as a way to do asset allocation.
Next there can be methods around timing the assets. E.g. If GOLDBEES were purchased in July 2019 and were held till say July 2020, the returns would be 32% worst case and 60% best case.


And then if NiftyBees were bought in August 2020 after selling Goldbees, we would end up with 25% returns worst case and about 52% returns in best case in just 1 year.


So, such cycle shifting of assets and proper mixing of percentages should help to preserve wealth over long duration of time and may be even grow your purchasing power parity if done correctly.
Since no one knows the future, a quantitative back tested approach and a bit of common sense can be very useful in taking decisions around asset allocation. Backtesting is useful in understanding the underlying sentiment of crowd and common sense helps in elimination of what not to classify as an asset.
For example, a few years back, Diamonds were an asset class. Today, there are companies which grow diamonds in lab. They are called as Lab grown Diamonds. They are so similar to what is found in nature that even an expert cannot make out any difference. So, Diamonds value collapsed and lost its characteristics of potential money as it was easily replicated and produced.
When evaluating an asset, it's crucial to consider its fundamental characteristics, especially its ability to act as a store of value. This means that the asset should maintain or ideally increase its purchasing power over time, protecting you from the erosive effects of inflation. Beyond this foundational quality, an ideal asset should also possess the potential to generate income or wealth through tangible economic activities. This can be achieved by engaging in business operations that provide goods or services, thereby creating real value in this world. In essence, a robust asset not only preserves wealth but also has the capacity to grow it through productive endeavors.
How to make a Quantitative Decision?
If we perform a statistical analysis such that we find out how the asset prices of our selected assets moved in time with respect to each other, then we will be able to find out a correlation of each asset with respect to each other. Such a matrix shall look something like below.
Asset Class | Gold | Nifty 50 | Cash (SGD) (10-year Bonds) |
Gold | 1 | -0.3 | 0.1 |
Nifty 50 | -0.3 | 1 | -0.1 |
Cash (SGD) (10-year Bonds) | 0.1 | -0.1 | 1 |
The correlation values presented in the matrix above are purely illustrative and have been randomly generated for the purpose of this example. They do not reflect actual historical data or real market conditions, 1 means the assets are moving in sync with respect to each other. -1 means assets move exactly in reverse with respect to each other. 0 means that there is no definite pattern or a correlation between two asset classes.
Ideally, we want assets which have very low correlation with each other. So, assets exhibiting a correlation of [-0.3 to +0.3] would mean that a sufficient diversification can be achieved so as to achieve the goal of wealth preservation. A strong negative correlation is also preferred for Cash to other asset which would appreciate rapidly on declining future worth of current cash. This gives us the clear choice of what should be kept more in place of cash.
From above we can decipher about selection of assets in our basket of asset allocation.
Deciding on percentages of various assets would require skills around market cycles and camarilla pivot based backtesting to understand the behavior of these assets.
Essentially Asset allocation involves selection of Assets, Timing the Market cycles and deciding of the proportions i.e. the percentage allocation of each asset in your portfolio. This truly can be a powerful and only way to preserve your wealth and fulfil the most important quality of money, the Store of Value!
Disclaimer:
The information provided in this article is for educational and informational purposes only. It is not intended to be financial advice, and it should not be relied upon as such. The content is based on the author's opinions and experiences and is not a substitute for professional financial advice.
Investing in financial markets involves risk, and past performance is not indicative of future results. The strategies and methods discussed in this article are not guaranteed to produce positive outcomes, and there is no assurance that following the ideas discussed in the article to result in wealth preservation or growth.
Quantway Consulting and the author of this blog are not liable for any financial mishaps, losses, or damages arising from the use of the information provided herein. Readers are encouraged to conduct their own research and consult with a qualified financial advisor before making any investment decisions.
This article does not constitute an offer or solicitation to buy or sell any securities or financial instruments. The information provided is general in nature and may not be applicable to all individuals or situations.
Quantway Consulting and the author reserve the right to modify, update, or discontinue this article at any time without notice. By accessing and using the information in this article, you acknowledge and agree to the terms of this disclaimer.


Comments