Enhancing Intraday Trading: Backtesting a Mean Reversion Bot with Camarilla Pivots and GPT
- Shantanu R Nakhate

- Oct 3, 2024
- 3 min read
Updated: Dec 11, 2024

In this article I show how I did back-testing for a particular stock for intraday trades using the camarilla pivots. One of the ideas I found useful, was to play the mean reversion setup after R4 failure. Say on a given day stock price hits R4 and passes upwards from R4 and then starts to fall back below R4. This is a strong setup for mean reversion in intraday timeframe. I wanted to test this hypothesis. So, I developed a python code which gives insights about what exactly happened in past for such occurrences.
Below is the image of a random stock chosen for analysis. It broke R4 on 10 Sep 2024 and failed immediately. This is where mean reversion will give good returns, is the hypothesis and needs to be back-tested so that we can generate steady returns by forming a trading process/playbook over multiple large trade sample size.

I got the past 5min intraday and 1 day data from Smart API from Angel/ Breeze by ICICI.
Then I got Copilot/ Chat GPT to write me the python code for developing the back-tester.
After running the code, I got following csv as output.


Datetime column mentions the time when selling decision was taken by the back-tester bot.
Sell Price is the price at which we were able to sell the stock at desired position size.
Lowest Value is the lowest price that was reached after bot sold the stock.
Close Value is the closing price of the stock for that day.
Max Gains are calculated as hypothetical max gains that shall happen if we were able to sell at the lowest value after selling.
Close price gains are the gains that happen by holding on to the stock after selling.
Stop loss gains are the losses that happened after stop loss was triggered after selling.
Stop loss is set at 1% above R4.
From above you can get insights around how the trade shall perform if you were to use the algorithm.
You can find out the best possible fixed gain which you should fix after selling decision so that on average, you will get a good edge in trading.
E.g. when I find average for Max Gains column, I get 2.19% as Average value. So, if we book profits after selling decision at 1% then results can be?
Let’s back test it.

From back-test I found that if I run bot 2406 times when trade was triggered, I made 0.445% on average, with net sum of 1070%. Here I have not included brokerage and other charges. There were corner cases when trading should be avoided completely due to circuit limits placed by exchanges which caused bot to give poor performance. This can be found from the back-test data itself.
If you reach a 1%++ here on intra gains it can be a very profitable scenario even with brokerage and other charges!!
You can find the code and required csv data on github!
Some more trials after increasing fixed gains value.
Fixed Gains at 1.9:
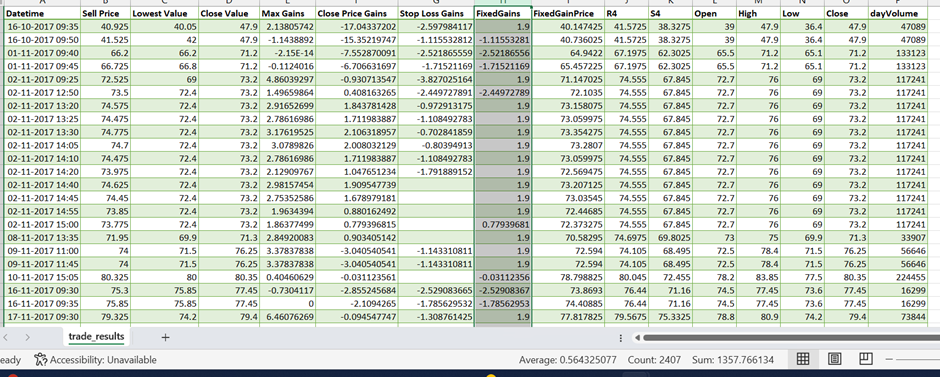
For 1.9% fixed gain you get 0.56% as average returns and overall returns of 1357% over 2406 trades.
Fixed gain at 2.4

or 2.4% fixed returns you get 0.57% of average returns per trade and overall returns of 1384% over 2406 trades.
So, in simple terms, 1000 Rs trade capital shall generate 13840 Rs over 2406 trades excluding broking charges and taxes!


Comments